
2016 Property Claim Trends – Regionality of Claims
Analyzing property claim trends presents a significant opportunity for insurance executives and adjusters alike to improve and plan for the future. Our Annual Claims Report provides many property claim trends that are valuable to property and casualty insurance claim professionals. One set of compelling statistics is the regionality of claims.
How claims are distributed by region provides powerful insights for everything from staffing requirements to expense reserve planning. This trend also has a significant impact on customer satisfaction rates. In the J.D. Power 2017 US Property Claims Satisfaction Study, those regions with less claim activity (particularly less complex claim activity) had much higher claim satisfaction ratings than the regions with more volatile weather.
Distribution of Claims by Region
For the purposes of addressing claims by region, we segment the 50 states into the following regions:
- Northeast: Connecticut, Maine, Massachusetts, New Hampshire, New Jersey, New York, Rhode Island, Vermont
- Mid Atlantic: Delaware, Maryland, Pennsylvania, Virginia, Washington DC, West Virginia
- Southeast: Alabama, Georgia, Florida, Mississippi, North Carolina, South Carolina, Tennessee
- Southwest: Arizona, Arkansas, Louisiana, New Mexico, Oklahoma, Texas
- West: Alaska, California, Hawaii, Nevada, Oregon, Washington
- Central West: Colorado, Idaho, Kansas, Montana, Nebraska, North Dakota, South Dakota, Utah, Wyoming
- North Central: Illinois, Indiana, Iowa, Ohio, Kentucky, Michigan, Minnesota, Missouri, Wisconsin
As seen in the map below, in 2016, the Southwest and Southeast accounted for the majority of the HVAC claims. These regions have the highest frequency of weather patterns accompanied by Hail, Lightning, and Flooding, which are all particularly damaging to HVAC systems.
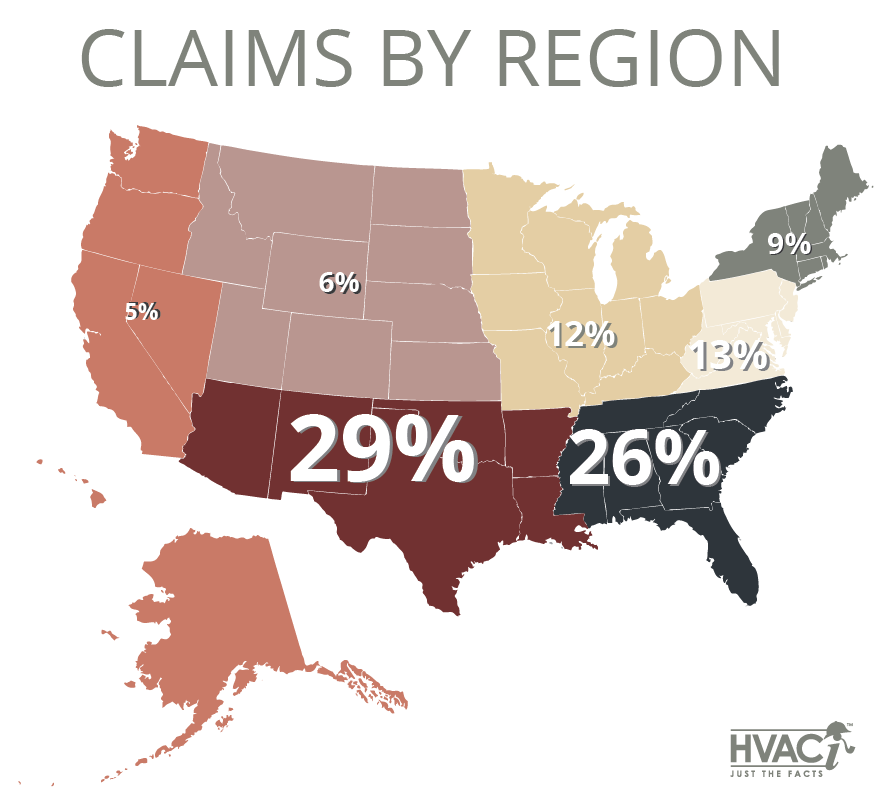
The Annual Severe Weather Summary by NOAA illustrates the number of reported tornado, hail, and wind events for each state. Broken out into our regions, Central West had the highest frequency of severe weather. However, the combined population only represents a little over 5% of the nation. In opposition, the West represents close to one fifth of the US population, but less than 1% of severe weather occurred in the combined states during 2016.
As you can see, the distribution of claims is influenced by a combination of severe weather and population. Accordingly, the Southeast and Southwest combined represent approximately 35% of the population and 35% of severe weather reports.
Theft Claims by Region
Theft and vandalism can occur anywhere, but as illustrated by the graph below, the frequency of theft claims in the West is much greater than in other regions of the country. This calculation is based on theft as a percentage of total claims for the region. As mentioned previously, the states that make up the West Region (Alaska, California, Hawaii, Oregon, Nevada, and Washington) accounted for less than 1% of the nation’s severe weather in 2016. Most of the claims in the West are thus less likely to be caused by severe weather and natural catastrophe events and instead are disproportionately impacted by other causes of loss, like theft and vandalism.
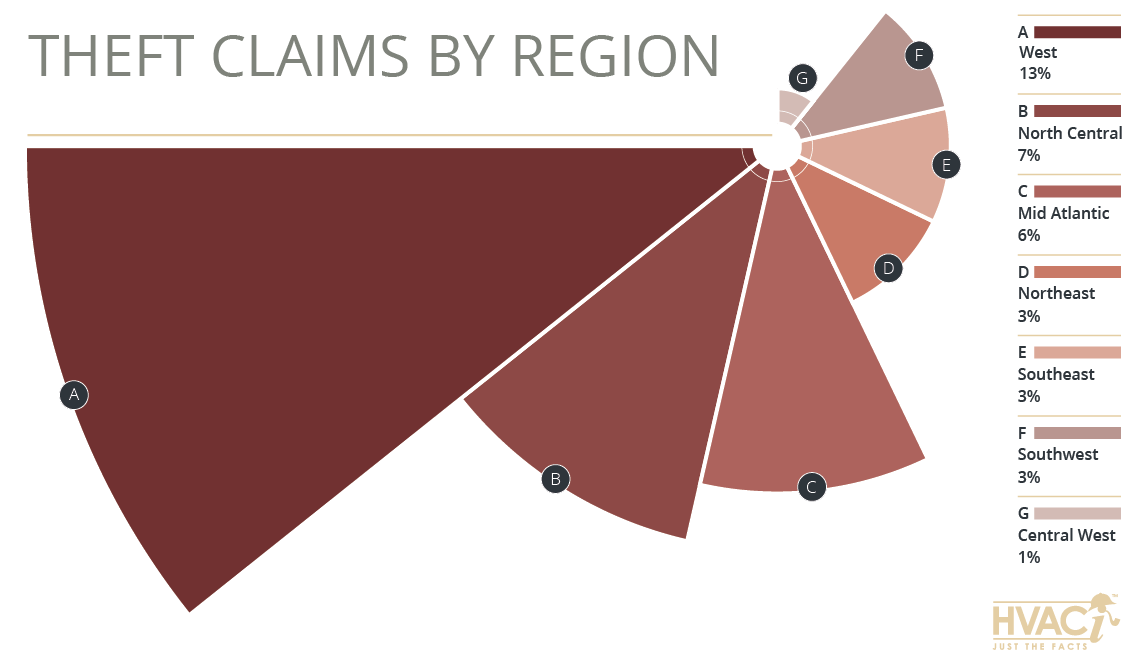
According to Travelers Insurance, Theft accounted for 6% of their homeowner’s claims between 2009 and 2015. This puts the West region at more than twice the national average for Theft claims. Whereas areas that are more often impacted by severe weather, such as the Central West, Southwest, and Southeast, have much lower Theft claims frequencies than the national average.
Wear & Tear Claims By Region
In 2016, the Northeast, Mid Atlantic, and Southeast all displayed high frequencies of systems damaged by age-related Wear & Tear. Wear & Tear claims are commonly misreported, owing to (among other things) a lack of formal education on the part of local contractors for Lightning diagnosis. For instance, several symptoms that are actually indicative of Wear & Tear (such as burned / charred wires and acidic refrigerant) are commonly mistaken for Lightning damage.
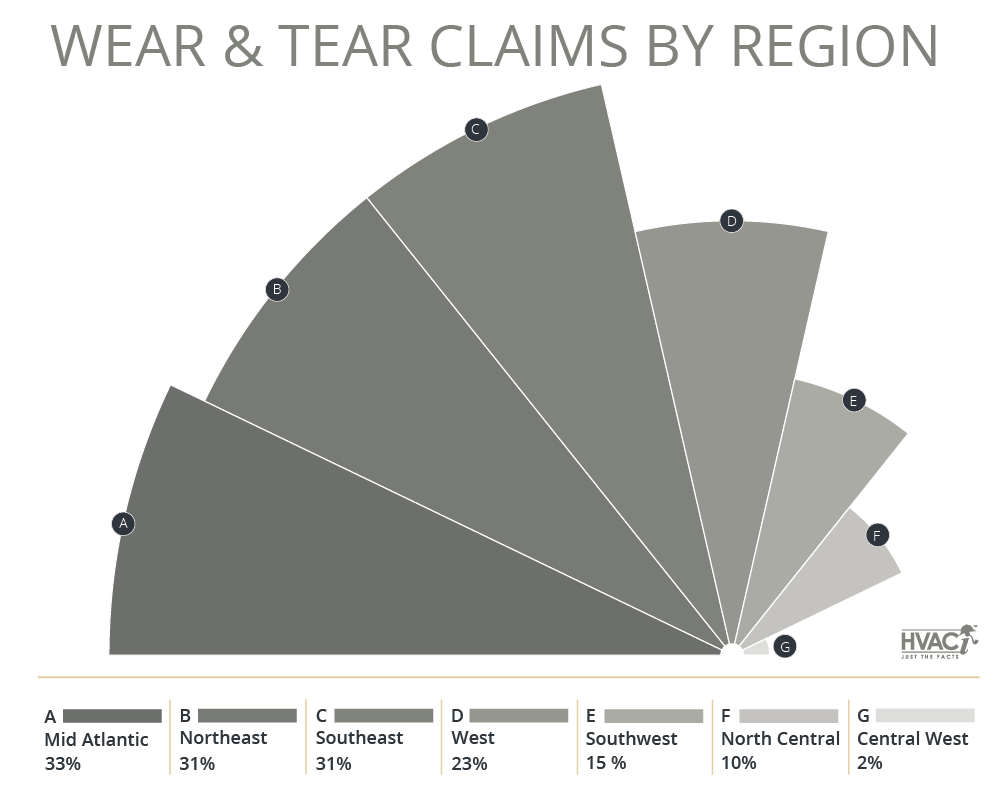
Additionally, in the Northeast, we see a high frequency of claims for damages to boilers. As boilers can have a longer life than typical HVAC equipment, many boilers fail due to age-related Wear & Tear. In fact, the average age of a boiler that we assess is 23.4 years, despite the fact that the average life expectancy of a boiler is closer to 15 years (Do It Yourself). Certain regions, like the Southwest, Central West, and North Central, show a high frequency of Hail claims, leading to a much lower relative frequency of Wear & Tear related damages.